Air Emissions

Since 1993, ISO New England has produced an annual report on generator air emissions—a comprehensive analysis of the emissions produced by the region’s generation fleet and a review of relevant system conditions. The ISO also publishes real-time emissions estimates on ISO Express.

Significant Long-Term Reductions

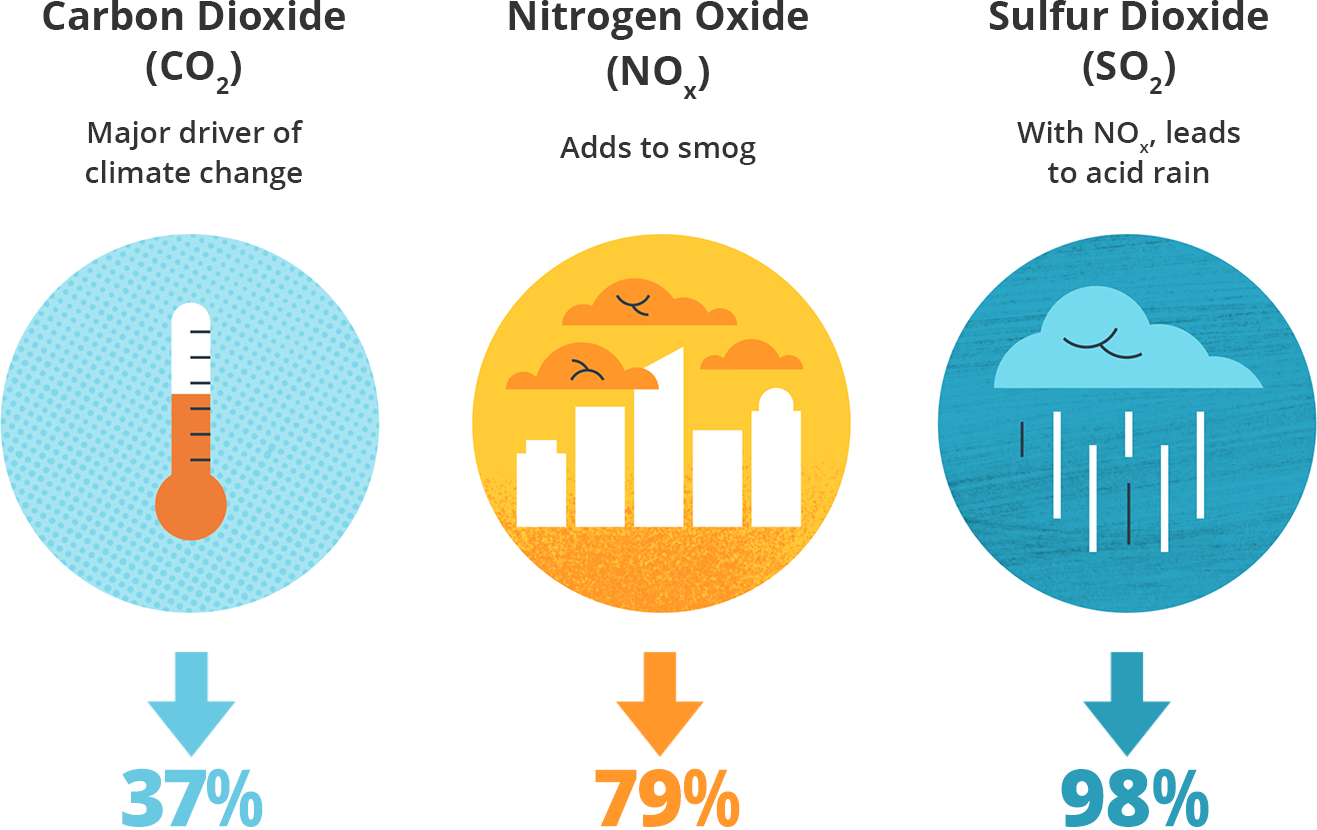
Air emissions from regional generators have fallen dramatically since the early 2000s. From 2001 through 2022, annual emissions for sulfur dioxide (SO2), nitrogen oxides (NOX), and carbon dioxide (CO2) declined by 98%, 79%, and 37%, respectively.

Fast Stats
  • 98%, 79%, and 37% decrease in annual regional emissions between 2001 and 2022 for sulfur dioxide (SO2), nitrogen oxides (NOX), and carbon dioxide (CO2), respectively
  • 0.5% of the electricity produced in New England came from oil- or coal-fired resources in 2023, compared to 40% in 2000
  • 39% of the electricity produced in New England in 2023 came from resources that do not emit carbon dioxide

New England Generator Air Emissions 2001 vs. 2022

generator air emissions

Source: 2022 ISO New England Electric Generator Air Emissions Report

However, several factors—including increasing oil-fired generation during winter cold snaps due to natural gas pipeline constraints and the retirement of nuclear generation—have slowed the declines or led to increases in some recent years. Learn about the changes between 2021 and 2022, for example, in the 2022 ISO New England Electric Generator Air Emissions Report.

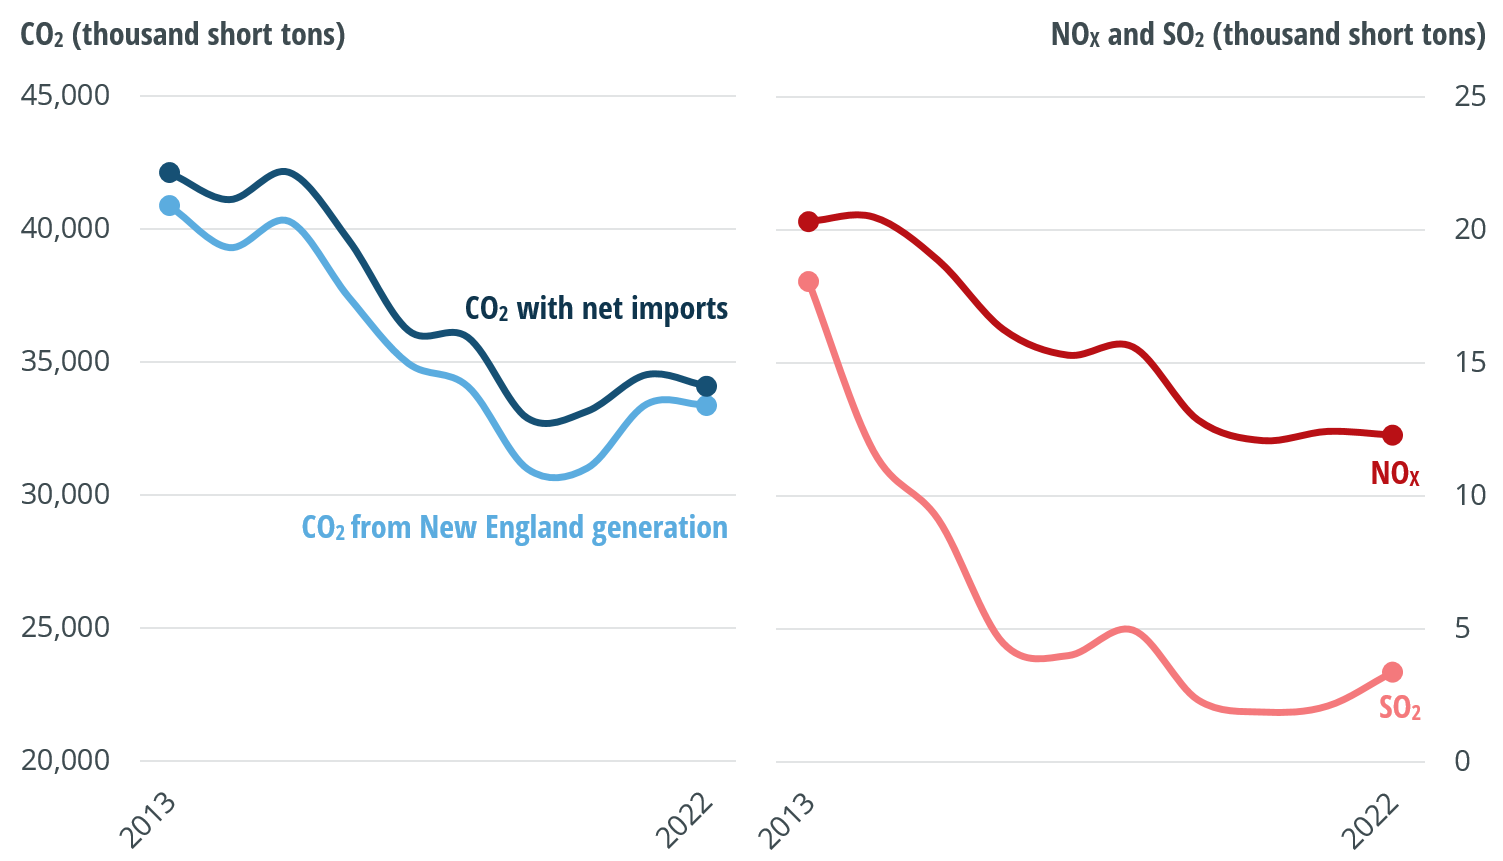
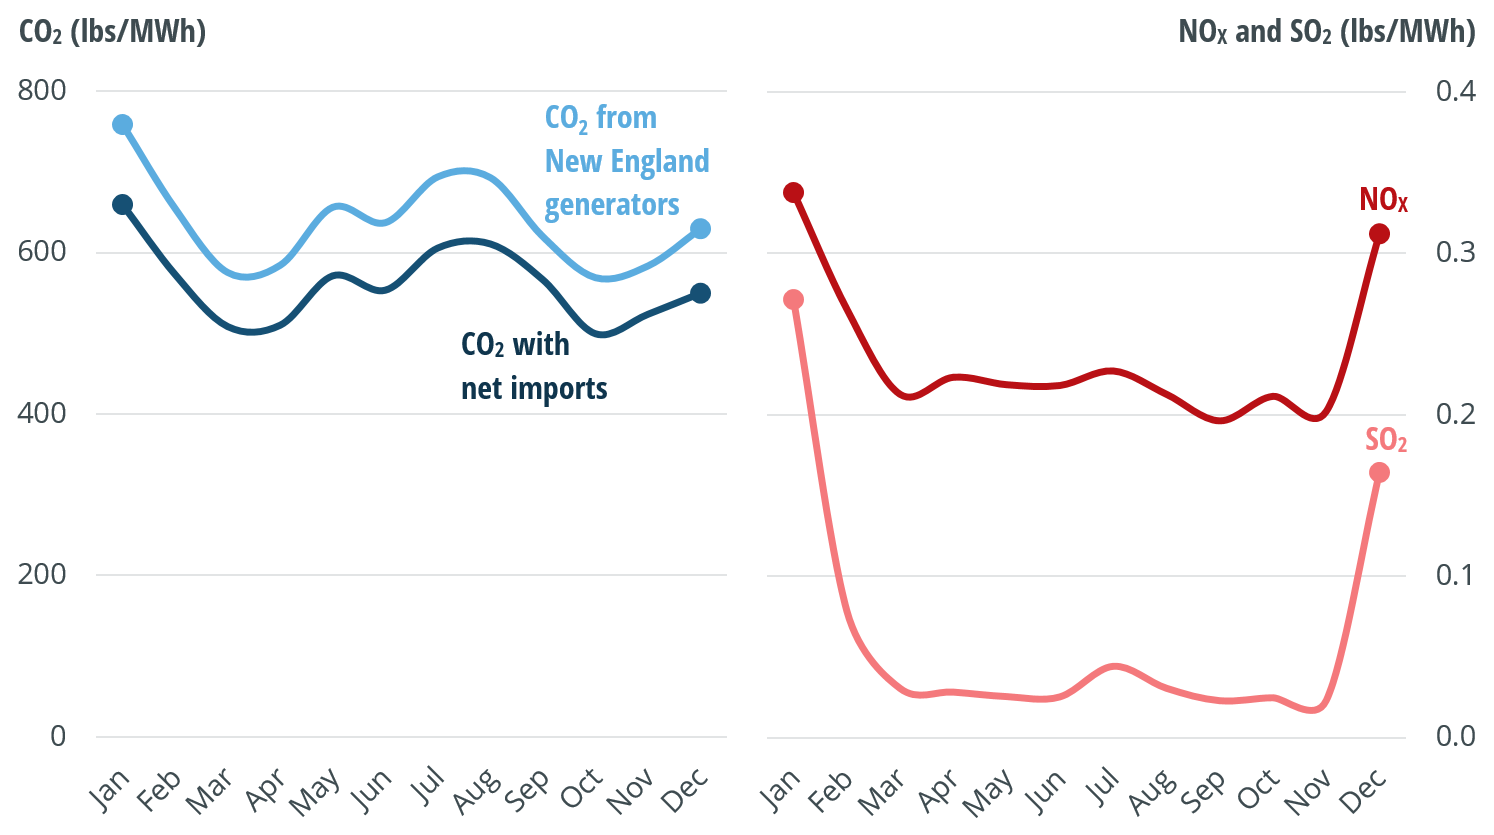
The table below summarizes estimated annual emissions for 2022 as well as emission rates (the pounds of emissions given off, on average, with every megawatt-hour of electricity produced). This is akin to comparing how many gallons of gasoline a car used versus its miles per gallon. The table includes figures for emissions from electricity produced by power plants located in New England, as well as data on emissions associated with New England generation plus electricity imported from other regions.

Annual Emissions and Emission Rates

New England Generation 2022 emissions (kilotons) Change from 2021 2022 emission rate (lbs./MWh) Change from 2021
NOx 12.3 -1.1% 0.24 -3.3%
SO2 3.38 +60.3% 0.07 +56.9%
CO2 33,382 -0.2% 643 -2.3%
New England Generation And Imports        
CO2 34,105 -1.3% 565 -1.5%

Annual Power Sytem Emissions, 2013 to 2022 (Thousand Short Tons)

generator emissions

Source: 2022 ISO New England Electric Generator Air Emissions Report

Drivers of Long-Term Emissions Reductions

Several factors have played a role in the overall reduction of generator air emissions:

  • Natural gas—The biggest contributor has been the region’s shift to lower-emitting, highly efficient natural-gas-fired generation. Natural gas-fired resources account for the vast majority of new generators built in New England since 1997, and they typically outcompete oil- and coal-fired generators in the marketplace to serve the region’s electricity needs.
  • Transmission—Improving weak spots and eliminating bottlenecks on the transmission system has allowed these new efficient, low-emitting generators to interconnect to the grid, run more often, and displace older, less efficient resources.
  • Tighter emissions controls—Implementation of emission controls, as required by federal regulations and stringent, leading-edge requirements set by the New England states, have helped reduce emission levels from coal-fired resources when they do run, contributing to the striking long-term decrease in SO2, in particular.
  • Renewables—The region’s increasing development of wind, solar, and other zero-emission resources will further contribute to reducing greenhouse gases.
  • Imported electricity—Since 2004, lower-priced electricity from outside New England has increasingly flowed in to serve regional demand, much of it from Canadian hydropower.
  • Less demand—Since about 2005, annual demand for wholesale electricity from the regional power system has been declining, and with it, so has electricity generation. The Great Recession of the late 2000s and slow recovery helped dampen electricity consumption. Several long-term factors have also been at work to reduce the amount of power consumers pull from the grid, such as:
    • Energy-efficiency (EE) investment—The New England states are investing more than $1 billion annually and are national leaders in implementing EE measures, such as the use of more efficient lighting, appliances, cooling, and building operation.
    • Active demand resources—These power resources compete in the wholesale electricity markets by reducing the amount of power they’d normally pull from the grid, using practices like powering down machines or switching to an on-site generator.
    • Distributed generation—The growing number of small-scale solar power systems are one example of how more and more New Englanders are supplying some or all of their own power.

Year-Over-Year Variables

Two overarching factors are largely responsible for year-over-year changes in emissions:

  • The weather—Electricity demand is driven primarily by weather. Higher demand requires more electricity generation, which typically results in more emissions. Because of this, comparing annual cooling and heating degree days can provide some perspective. In 2022, there were 367 cooling degree days, which is 16% higher than the 20-year average. There were 5,616 heating degree days, which is 7% lower than the 20-year average. In other words, the summer and winter were warmer than average. Overall, total energy generation increased by 2% from 2021 to 2022.

    Degree days are calculated by comparing a day’s mean temperature to the base point of 65°F. Each degree above 65°F is counted as one cooling degree day, while each degree below is one heating degree day. A day’s mean temperature of 90°F, for example, equals 25 cooling degree days, while a mean temperature of 45°F equals 20 heating degree days.
  • Power plant availability—New England’s power plant air emissions are also related to the specific units available and dispatched to serve electricity demand. The region’s higher-emitting generators tend to be dispatched when the weather drives up demand on very hot, humid summer days or when wintertime cold snaps lead to constraints on the interstate natural gas pipelines, which cause natural-gas-fired generation to become expensive or unavailable.

    Increasing amounts of installed wind power and other renewable power resources also play a role in seasonal emissions trends. In 2022, annual energy produced by non-emitting sources, such as nuclear, hydroelectric, solar, and wind generation, increased by 11%. Hydroelectric, solar, and wind generation exhibit seasonal differences in their output due to “fuel” availability—there’s less rain and onshore wind during the summer months. In winter, solar power doesn’t help meet the peak, which happens after sunset, and cannot produce power during cloudy conditions and during or soon after snowfall. Additionally, most regional solar power serves to reduce—not serve—electricity demand because it’s not connected to the regional transmission system.

2022 New England Average Monthly Emission Rates

air emissions

Source: 2022 ISO New England Electric Generator Air Emissions Report

Factors that Could Erode Emissions Reductions Going Forward

Some emerging factors could push the ISO to rely more on higher-emitting, less efficient resources to meet regional electricity demand:

  • Delays in building new power resources such as offshore wind.
  • New transmission lines needed to maintain reliability, as well as elective transmission projects that can connect to clean-energy resources, are often met with opposition.
  • Some states are tightening emission limits for all generators—even state-of-the-art units running on relatively low-emitting natural gas. This could force the ISO to run higher-emitting generators in other parts of the region.
  • Any additional closures of regional nuclear facilities will remove major sources of zero-emission energy for New England.