Highlighted below are some of the most commonly used maps and diagrams related to ISO New England’s operation of the region’s electric power system and settlement of the wholesale electricity marketplace. Other, more specific maps and diagrams can be found on ISO Express, in ISO training materials, and in Reliability Committee materials. If you’re unable to find a specific map or diagram you need, please contact Participant Support.
Available below:
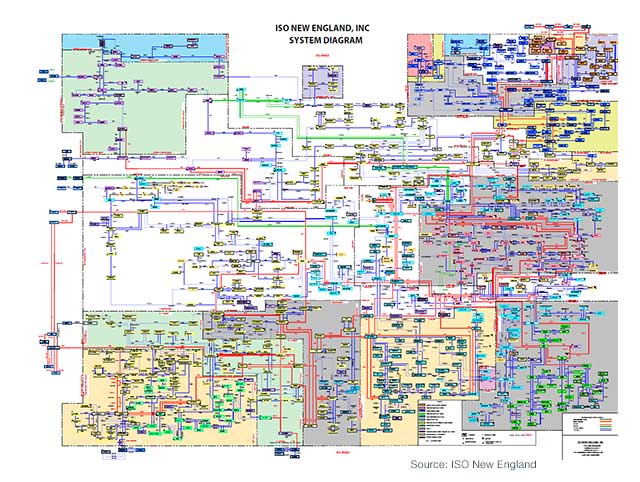
The diagram shown here illustrates, in relative geographic location, the substations, transmission lines, and interconnections with neighboring grids that make up the New England power system. (For interconnection definitions, see Generic Interface Constraints.) The diagram shows existing facilities and facilities that are expected to be placed in service in the near future.
If you have Critical Energy Infrastructure Information (CEII) access and the appropriate digital certificate, you can also download the Regional Transmission 345kV System Diagram.
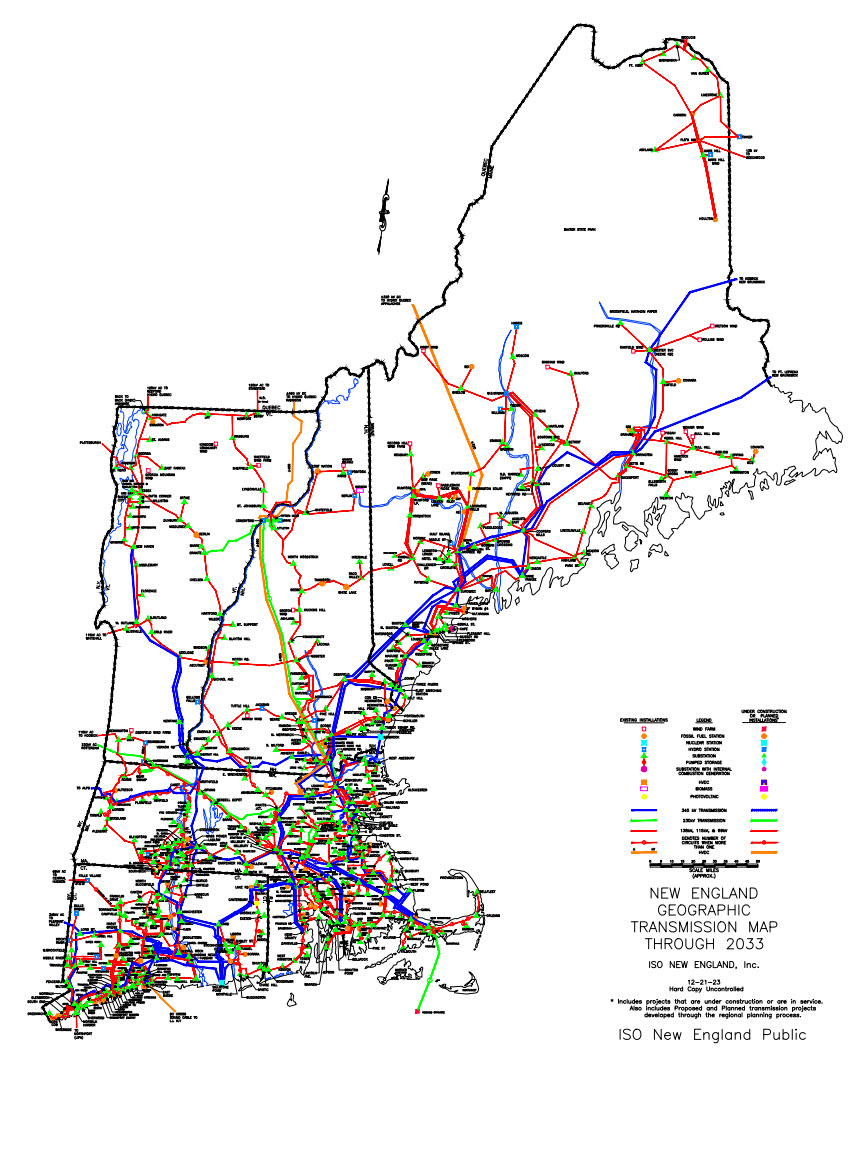
This diagram shows the transmission lines, transmission facilities, and many of the generators that are currently interconnected to the system and planned.
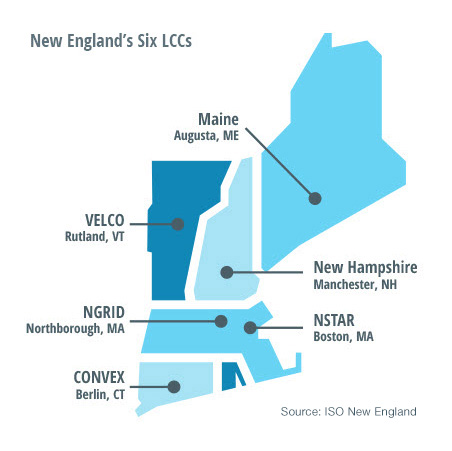
From its master control center (MCC), the ISO is responsible for operating all transmission facilities rated 115 kV and above. New England also has six LCCs, which are run by transmission owners and are responsible for operating transmission facilities rated 69 kV and above, with certain exceptions. Master and local control center (M/LCC) procedures guide the relationship and coordination of operations between the MCC and LCCs.
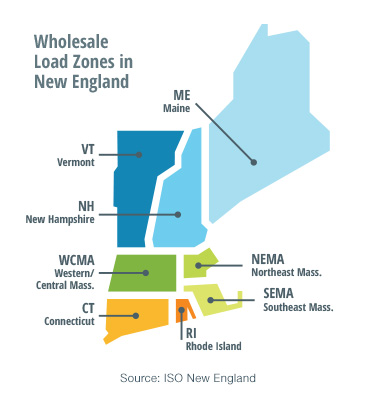
Pricing in the wholesale electricity marketplace is calculated at individual generating units, about 900 load nodes (specific points on the transmission system), eight load zones (aggregations of load nodes), and the Hub (a collection of locations in central New England where little congestion is evident). This map depicts the eight load zones.
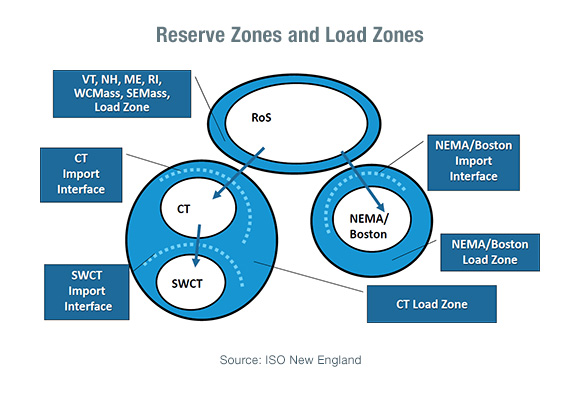
The Forward Reserve Market procures reserve capacity for the region, which is divided into four reserve zones:
This diagram illustrates the relationship between the reserves zones, load zones, and interfaces.
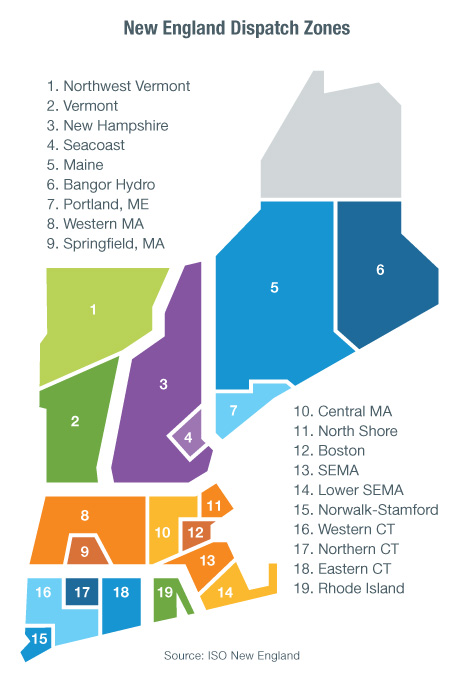
The region is divided into 19 dispatch zones for the purpose of administering active-demand-resources. The zones, which are groups of pricing nodes, allow for a more granular aggregation of active demand resources at the locations and quantities needed to address potential system problems.
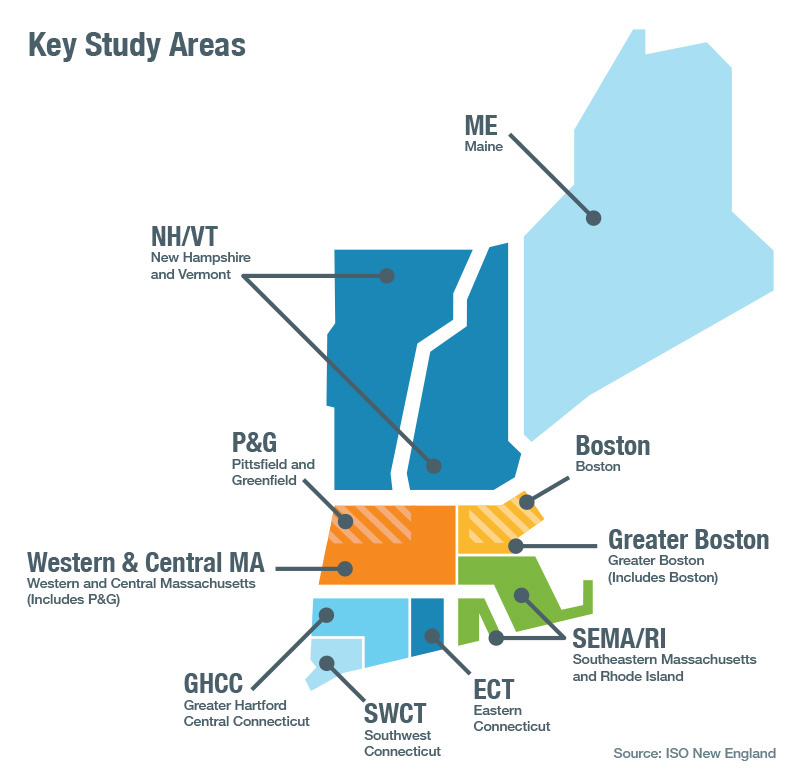
For ISO studies of the New England transmission system, the region is subdivided into key study areas for practical work management reasons or for focus on a particular technical issue. The ISO regularly conducts needs assessments and other assessments in these key study areas pursuant to the Open Access Transmission Tariff (Section II of the ISO Tariff). The assessments and studies involve stakeholder review and input, primarily by the Planning Advisory Committee, and form the foundation for the Regional System Plan.
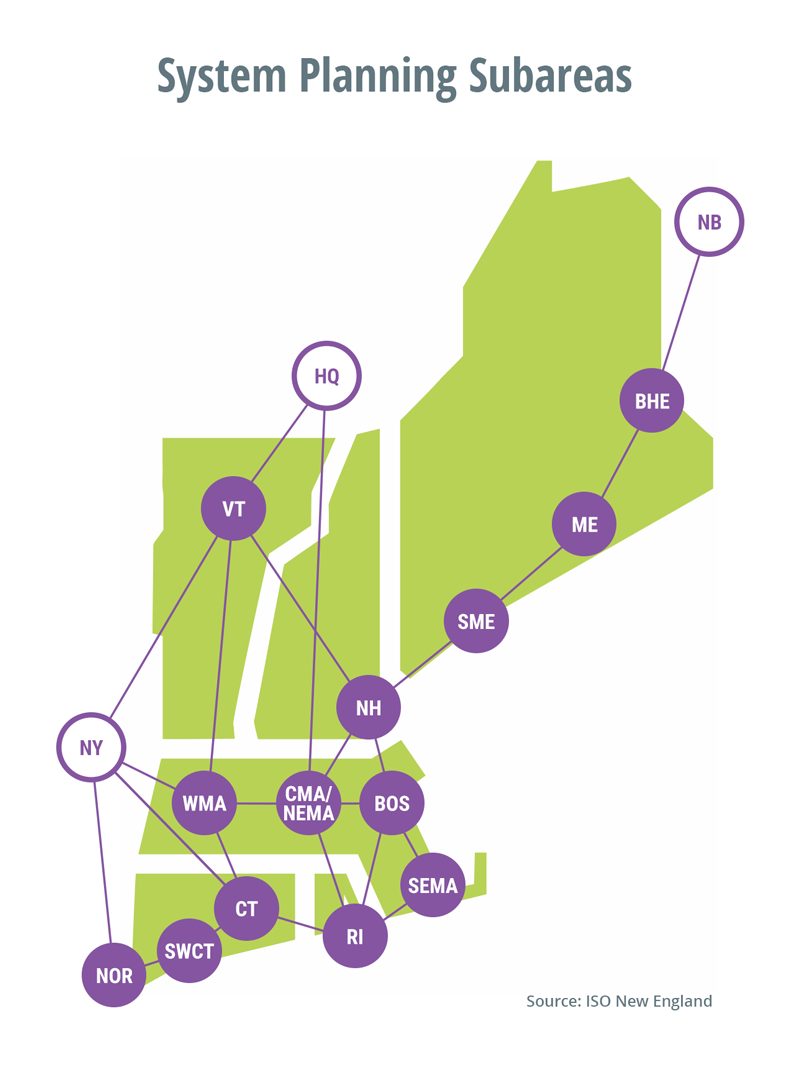
The ISO has also established 13 subareas of the region’s electric power system, which are shown here along with the three neighboring power systems:
These subareas form a simplified model of load areas connected by the major transmission interfaces across the system. The simplified model illustrates possible physical limitations to the reliable and economic flow of power that can evolve over time as the system changes. While transmission planning studies and the real-time operation of the system use more detailed models, the subarea representation shown here is suitable for some regional system plan studies of resource adequacy, operating-reserve requirements, production cost, and environmental emissions.
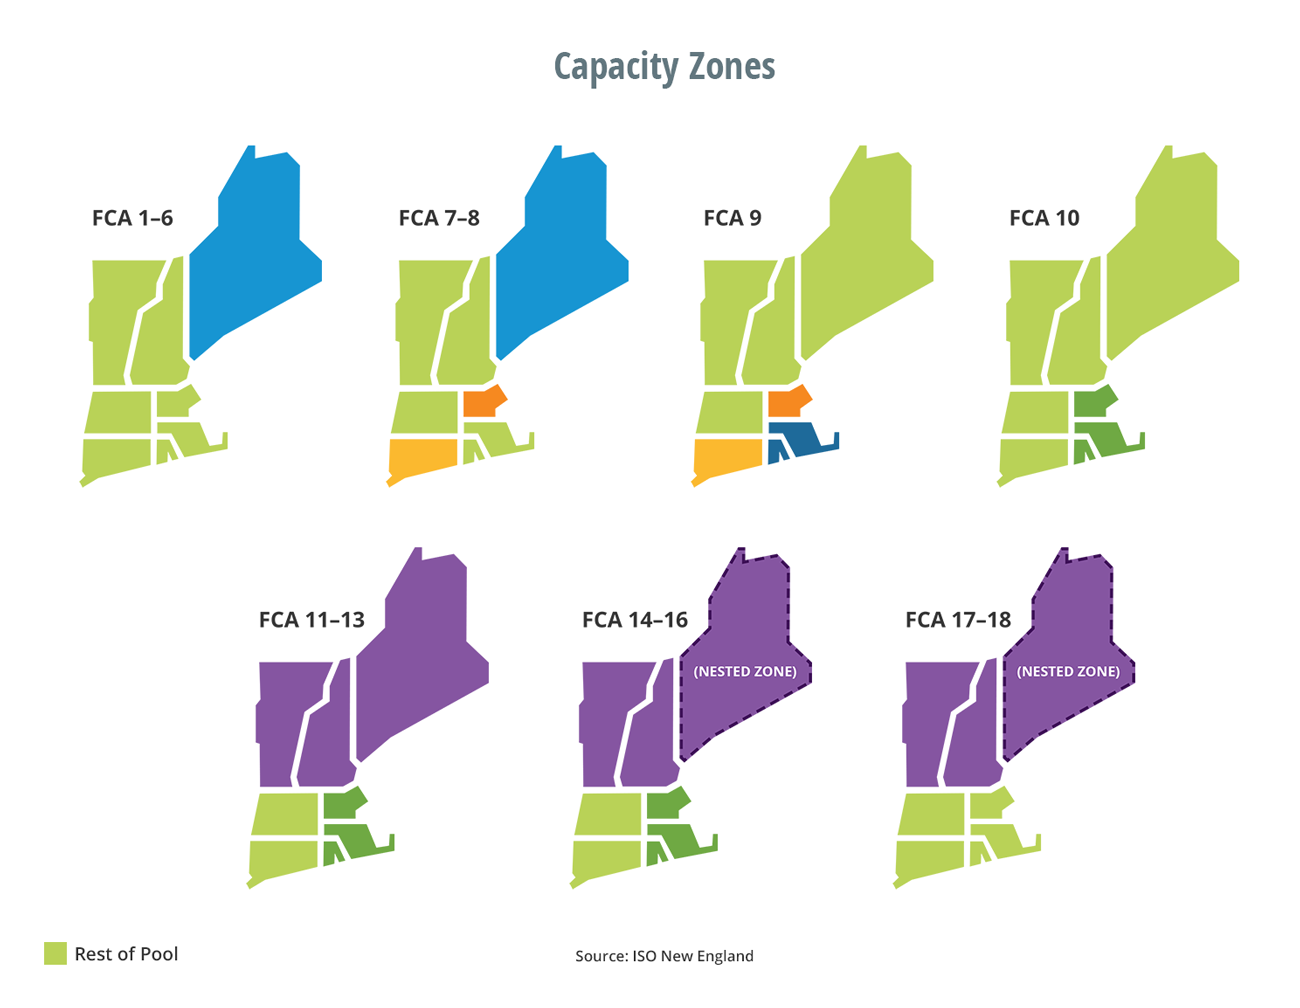
Capacity zones are a key input into the Forward Capacity Auction (FCA) and subsequent annual reconfiguration auctions because the amount of capacity purchased is based on these boundaries. They are specific geographic subregions (a combination of load zones) of the region’s electric power system that are designated before each FCA. The ISO establishes capacity zones on an annual basis and evaluates all transmission interface transfer limits that could be relevant to capacity zone modeling. Read more in the FCM Participation Guide and see the installed capacity requirement (ICR) filing for each FCA available on the ISO Filings to FERC page.
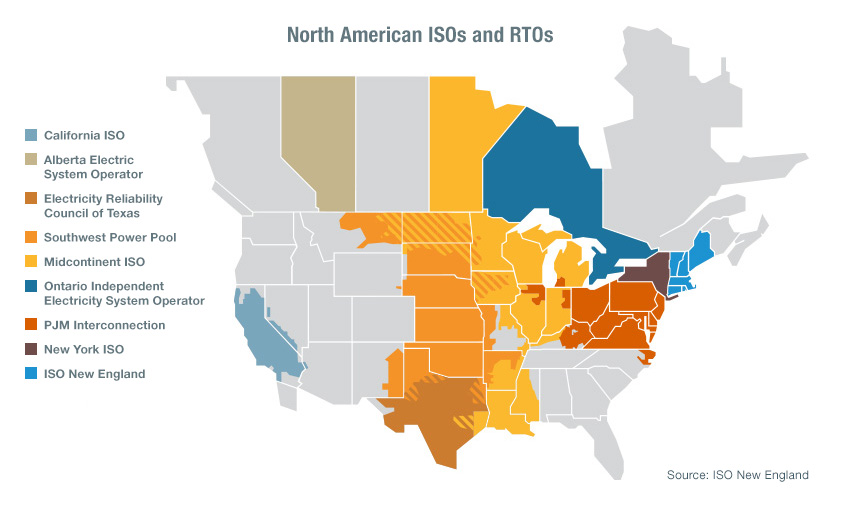
There are nine Independent System Operators (ISOs) and Regional Transmission Organizations (RTOs) in North America. ISO New England, a Regional Transmission Organization, covers the six states of Connecticut, Maine, Massachusetts, New Hampshire, Rhode Island, and Vermont. Striped areas indicate interwoven transmission lines or utility service territories. Learn more in Industry Standards, Structure, and Relationships.
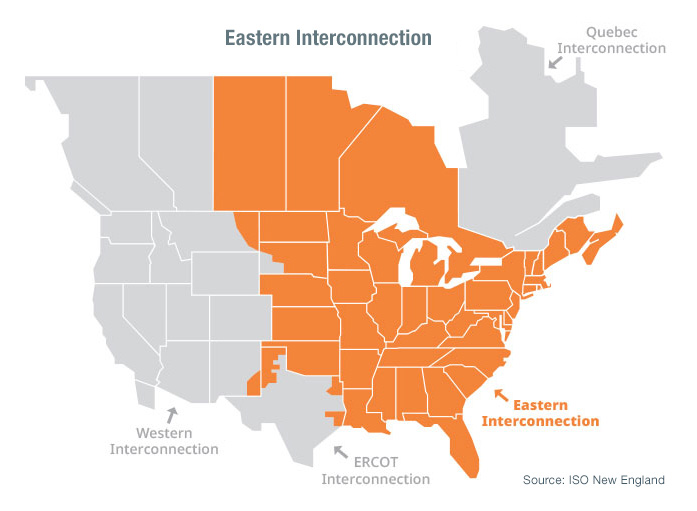
New England’s power system is part of the Eastern Interconnection—one of four large power grids in North America, which are independent from each other. Learn more in Industry Standards, Structure, and Relationships.
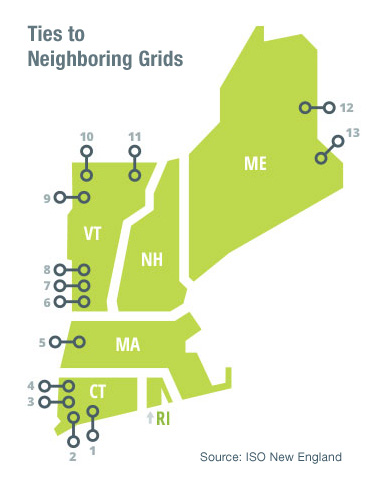
New England has 13 total interconnections to neighboring power systems:
Learn more in Industry Standards, Structure, and Relationships.
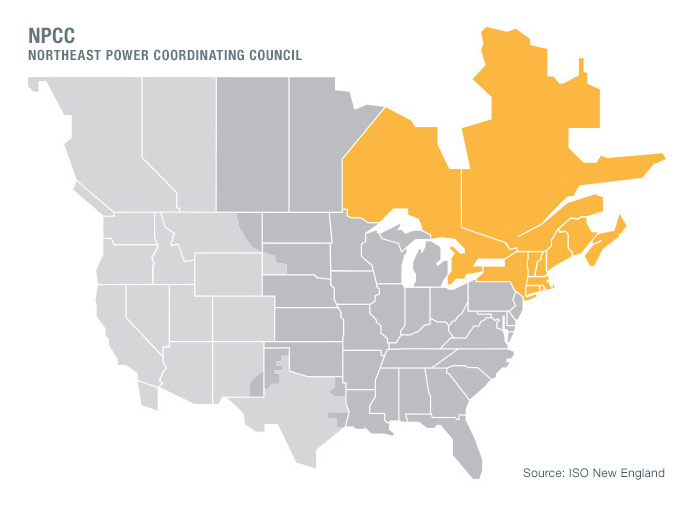
NPCC is one of eight regional entities that develop, implement, and enforce reliability criteria for the design and operation of the interconnected power systems. ISO New England develops and follows procedures in compliance with NPCC standards, as well as those of the North American Electric Reliability Corporation (NERC) and Federal Energy Regulatory Commission (FERC). Learn more in Industry Standards, Structure, and Relationships.