The region’s millions of households and businesses create the demand for electricity on the power grid, which must be produced the instant it is needed because electricity cannot easily be stored in large quantities.
Peak demand is the highest amount of electricity used in a single hour, and ISO New England must ensure that the region has sufficient power resources to meet the peak. The chart below shows the days with the highest peak demand recorded in New England since the ISO began managing the power grid in 1997. The highest peaks typically occur during the work week in summer. Note that as demand for electricity from the regional grid declines, system peaks are less likely to reach record levels. Nevertheless, high spikes in demand still occur, and New England’s power system must remain prepared to meet those peaks, even if they aren’t historically high.


Data for the top ten demand days comes from the Daily Summary of Hourly Data Report, available on the Zonal Information page. The daily peak load for the regional system is included in the “System_Peak” column on the “ISONE CA” worksheet. The “DT” (date type) column represents the day of the week, where Monday is 1 and Sunday is 7.
Annual energy use is lower now than it was in the early 2000s. But as shown in the chart below, levels of peak demand—the highest amount of electricity used in a single hour—can vary significantly from year to year. New England’s power system is planned and operated to serve demand during these peak hours, which still see spikes on hot, humid summer days, even if annual use is not historically high.
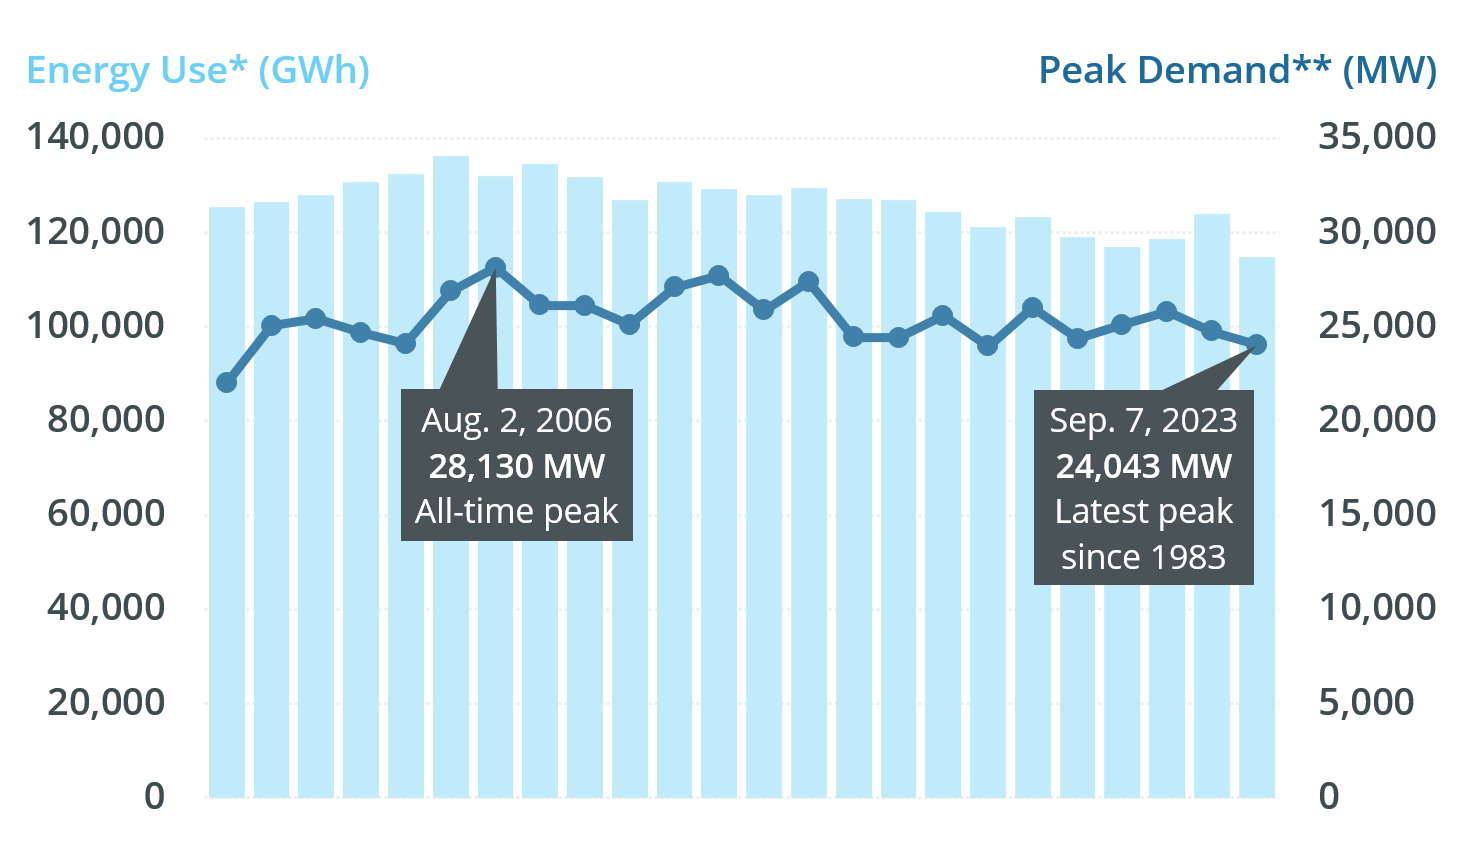
* Annual energy use, also known as net energy for load (NEL), is the total amount of grid electricity produced by generators in New England and imported from other regions during the year to satisfy all residential, commercial, and industrial customer demand.
** Peak demand represents the sum of metered generation and metered net interchange, less demand from pumped storage units. Starting with full market integration of demand response on June 1, 2018, this total also includes the grossed-up demand response value.
Today, about 25% of total system capacity is provided by distributed energy resources that reduce demand from the grid and the need to turn on or build power plants and other generating resources.
State policies and wholesale market revenues support energy efficiency (EE) and demand response programs. New England states invest billions of dollars in EE programs that promote the use of energy-efficient appliances and lighting and advanced cooling and heating technologies (about $7.8 billion has been budgeted for EE programs from 2015–2022 and another $10.7 billion is expected between 2024 and 2033). Nearly 3,700 MW of demand capacity resources (including demand response, energy efficiency measures, and distributed generation) reduce electricity demand from New England’s power grid—that’s more than 11% of system capacity acquired in the Forward Capacity Auction. And New England is first in the nation to innovate and enable demand resources to fully participate in the energy and reserve markets.
Providing incentives for local/residential solar power is also a top priority for New England policymakers, with the states spending billions of dollars on making solar energy affordable for consumers. In 2010, New England had about 40 MW of behind-the-meter solar photovoltaic (BTM PV) resources. Today, the region's BTM PV installations have a combined nameplate generating capability of more than 4,000 MW. The region is on track to exceed 8,000 MW over the next decade. Though these resources don’t participate in the markets, the markets are flexible to changes in grid demand, so grid electricity is not over-produced—or over-purchased.
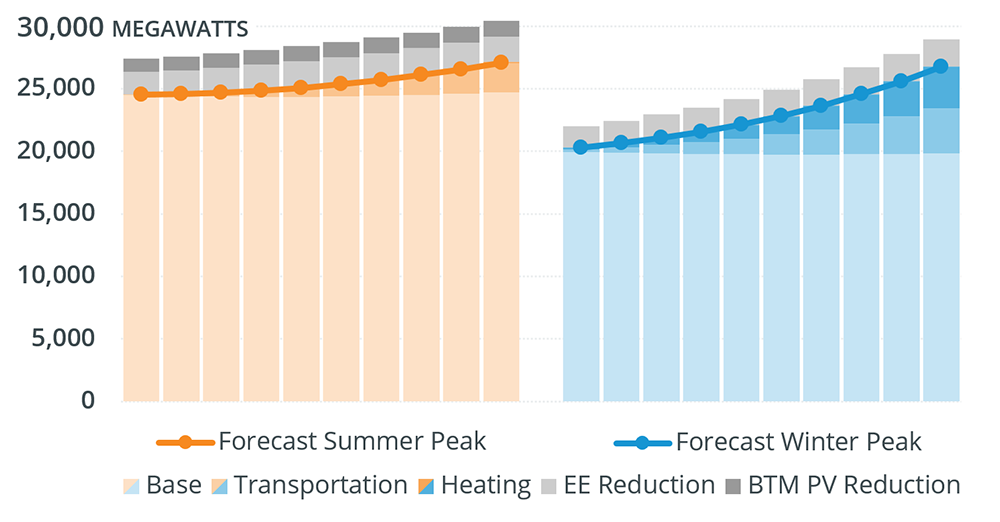
The ISO forecasts that both energy use and peak demand will increase in New England over the next 10 years. The primary factors for this increase are the additional energy and loads resulting from the electrification of the transportation and heating sectors. The ISO develops the gross long-term forecast for electricity demand using state and regional economic forecasts, years of weather history in New England, and electrification forecasts. Results of both the ISO’s energy efficiency (EE) forecast and solar photovoltaic (PV) forecast are applied to the gross forecast to develop a net long-term forecast. Since EE and PV reduce the amount of electricity consumers draw from the bulk power system, the net forecast represents actual grid demand.