Across New England, millions of households and businesses rely on electricity from the grid to power lights, appliances, machines, computers and phones, and more. Demand varies second to second throughout each day, meaning electricity must be available the instant it’s needed.
Net annual energy use in New England grew steadily between 1995 and 2005, driven primarily by increased economic growth and the increased use of air conditioning.
Since 2005, net annual energy use has trended downward, mainly due to an increase in energy efficiency from advanced cooling and heating technologies, energy-efficient appliances and lighting, and increasing levels of “behind-the-meter” photovoltaic (BTM PV) generation.
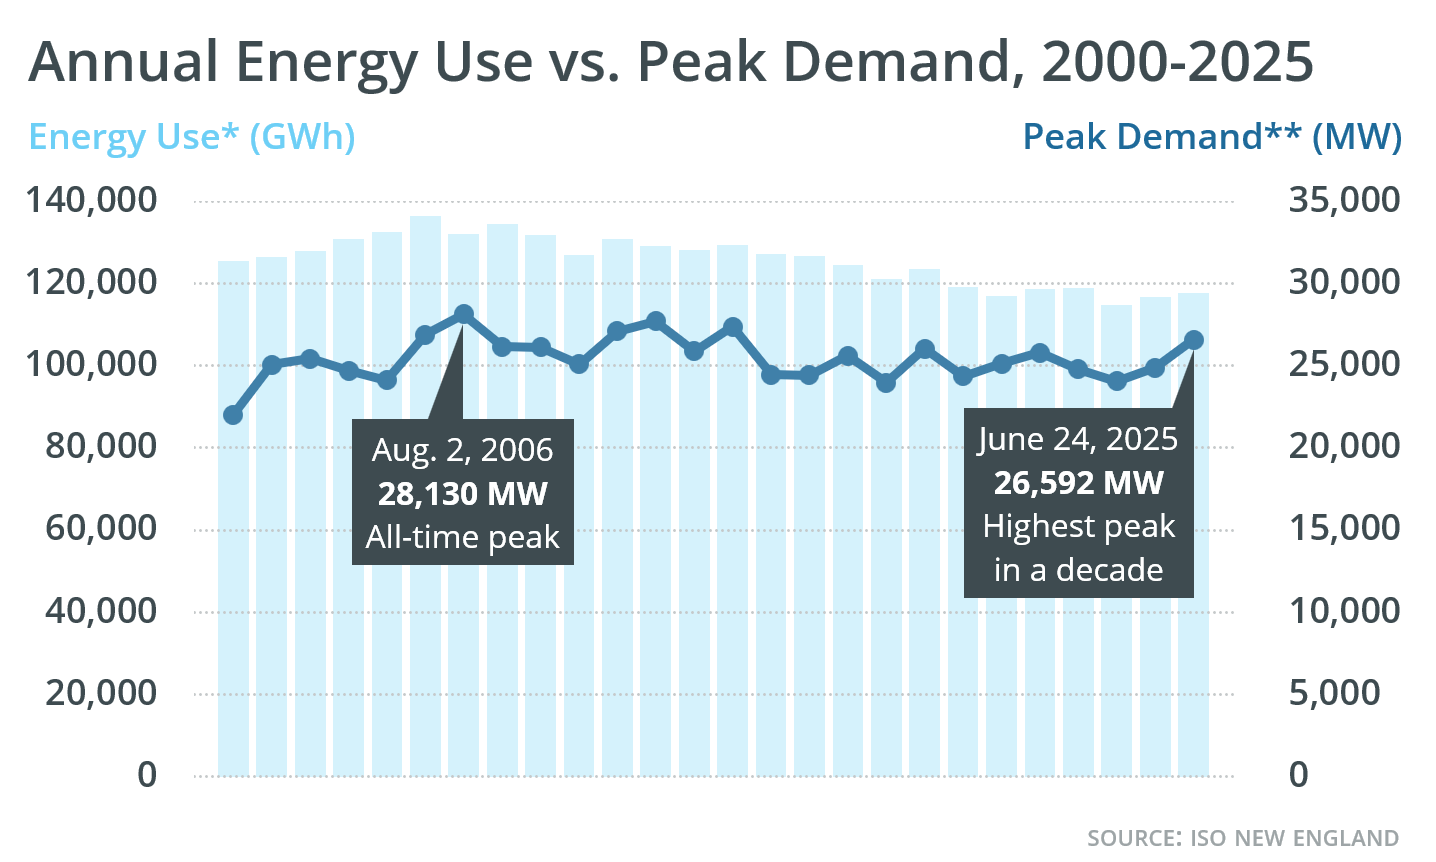
As shown in the chart below, though, levels of peak demand — the highest amount of electricity used in a single hour — can vary significantly from year to year. New England’s power system is planned and operated to serve demand during these peak hours, which can still see spikes even if annual use is not historically high.
* Annual energy use, also known as net energy for load (NEL), is the total amount of grid electricity produced by generators in New England and imported from other regions during the year to satisfy all residential, commercial, and industrial customer demand.
** Peak demand represents the sum of metered generation and metered net interchange, less demand from pumped storage units. Starting with full market integration of demand response on June 1, 2018, this total also includes the grossed-up demand response value.
New England typically reaches its highest demand for electricity during the summer, when warmer weather leads to increased use of energy-intensive air conditioning. The highest level of demand observed since the ISO began managing the power grid in 1997 was 28,130 megawatts (MW), recorded during a heat wave in August 2006.
Summer peaks on the hottest and most humid days have averaged around 25,600 MW since 2000, while peaks on the coldest days have averaged around 21,000 MW.
New England was a winter-peaking system until 1989, and in the early 1990s the region had similar winter and summer peaks. Growing use of air conditioning contributed to this dramatic change. However, as state policies drive adoption of electric space and water heating systems, New England is expected to again have a winter peaking system in the 2030s.
The region sees its lowest levels of demand in the spring and fall, with daily peaks averaging well below 20,000 MW. On mild, sunny days in these shoulder seasons, electricity produced by BTM PV installations can send demand for grid electricity plunging in a phenomenon known as the “duck curve.” Over the past several years, the ISO has observed record low levels of demand each spring. Such days are not disruptive from a grid operations perspective — the ISO’s sophisticated modeling and forecasting methods allow system operators to anticipate and prepare for these conditions.
| All Days | Winter Days | ||
|---|---|---|---|
| DATE | DEMAND (MW) | DATE | DEMAND (MW) |
| August 2, 2006 | 28,130 | January 15, 2004 | 22,818 |
| July 22, 2011 | 27,707 | December 20, 2004 | 22,631 |
| August 1, 2006 | 27,467 | January 14, 2004 | 22,477 |
| July 19, 2013 | 27,379 | January 18, 2005 | 22,141 |
| July 18, 2006 | 27,329 | January 16, 2004 | 21,931 |
Today, about 25% of total system capacity is provided by distributed energy resources that reduce demand from the grid.
State policies and wholesale market revenues support energy efficiency (EE) and demand response programs. New England states have invested billions of dollars in EE programs that promote the use of energy-efficient appliances and lighting and advanced cooling and heating technologies, with another $11 billion expected through 2033. About 2,600 MW of demand capacity resources (including demand response, energy efficiency measures, and distributed generation) reduce electricity demand from New England’s power grid — that’s nearly 9% of system capacity acquired in the most recent Forward Capacity Auction. And New England is first in the nation to innovate and enable demand resources to fully participate in the energy and reserve markets.
Providing incentives for local/residential solar power is also a top priority for New England policymakers, with the states spending billions of dollars on making solar energy affordable for consumers. In 2010, New England had about 40 MW of behind-the-meter solar photovoltaic (BTM PV) resources. Today, the region's BTM PV installations have a combined nameplate generating capability of about 5,500 MW. The region is on track to reach nearly 8,000 MW over the next decade. Though these resources don’t participate in the markets, the markets are flexible to changes in grid demand, so grid electricity is not over-produced — or over-purchased.
The ISO forecasts that electrification of transportation and heating will drive increases in both energy use and peak demand in New England over the next 10 years. The ISO develops gross long-term forecasts for annual and peak electricity demand using state and regional economic forecasts, years of weather history in New England, and electrification forecasts. Results of the ISO’s forecast for behind-the-meter solar photovoltaics (BTM PV) is applied to the gross forecasts to develop net long-term forecasts. Since BTM PV reduces the amount of electricity consumers draw from the bulk power system, the net forecasts represent actual grid demand.