The rapid increase in the number of solar power installations across New England has a growing impact on the region’s energy landscape. Most of these installations reduce demand for electricity from the power grid. Determining when they are reducing demand, and by how much, is critical to operating the grid, administering efficient wholesale markets, and performing long-term system planning.
State policies, state and federal support, tax credits, and falling technology costs are spurring remarkable growth in the installation of solar photovoltaic (PV) systems in New England.
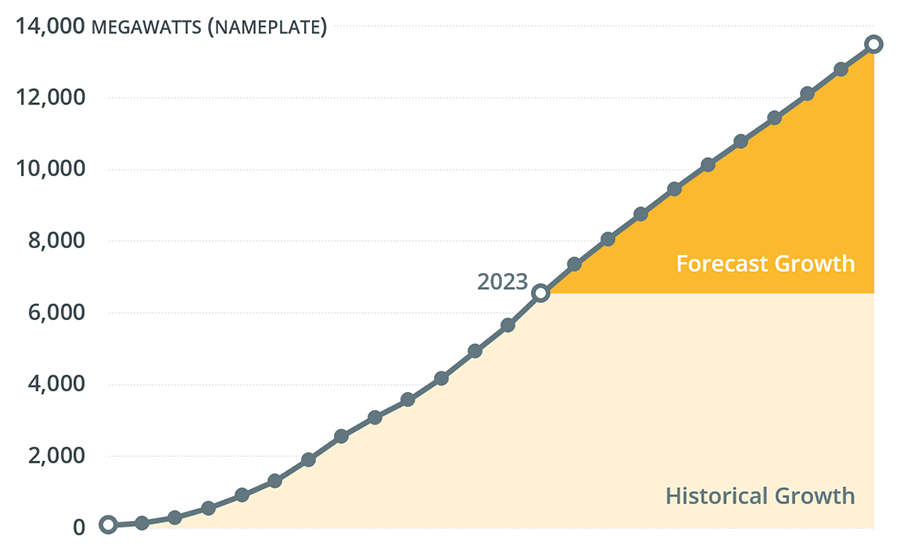
In 2010, the region had about 80 megawatts (MW) of solar generating capability. By the end of 2023, total solar generating capability across the six-state region amounted to about 7,300 MW. The installations, representing a variety of sizes and locations, produced an estimated 8,000 gigawatt-hours (GWh) of electricity in 2023.
Their combined generating capability, or nameplate capacity, represents how much electricity solar installations could generate if the sun were shining brightly everywhere in New England at the same time. In reality, depending on the time of day, regional variations in cloud cover, and other factors, solar output is never the same from moment to moment.
To aid system planning, the ISO annually projects the expected growth of certain kinds of solar installations. The ISO’s 2024 PV Forecast anticipates that about 13,500 MW of distributed PV capacity will produce about 16,900 GWh of electricityin 2033. That represents an increase of about 85% in both capacity and annual energy from 2024.
More than 350,000 distributed solar photovoltaic installations span the six states, with a combined generating capability of approximately 6,500 megawatts.
The vast majority of New England’s solar power is in the form of smaller-scale (typically 5 MW or less) systems, such as residential rooftop panels and systems installed on commercial buildings and parking lots. These systems are typically connected to local distribution utilities or provide power directly to homes and businesses. These installations reduce the amount of electricity being drawn from the grid and are sometimes referred to as behind-the-meter (BTM) PV. The ISO doesn’t dispatch BTM resources, and it can’t monitor their output in real time. But it has to manage their impact as a reduction in demand.
In 2019, ISO New England launched an initiative to integrate the effects of BTM PV into the computer models producing the daily operational load forecast. These efforts have improved the ISO’s ability to estimate the impact of BTM PV on daily power demand, though challenges persist when actual cloud coverage differs from what is forecast. The ISO continues to expand and refine its solar forecasting methods.
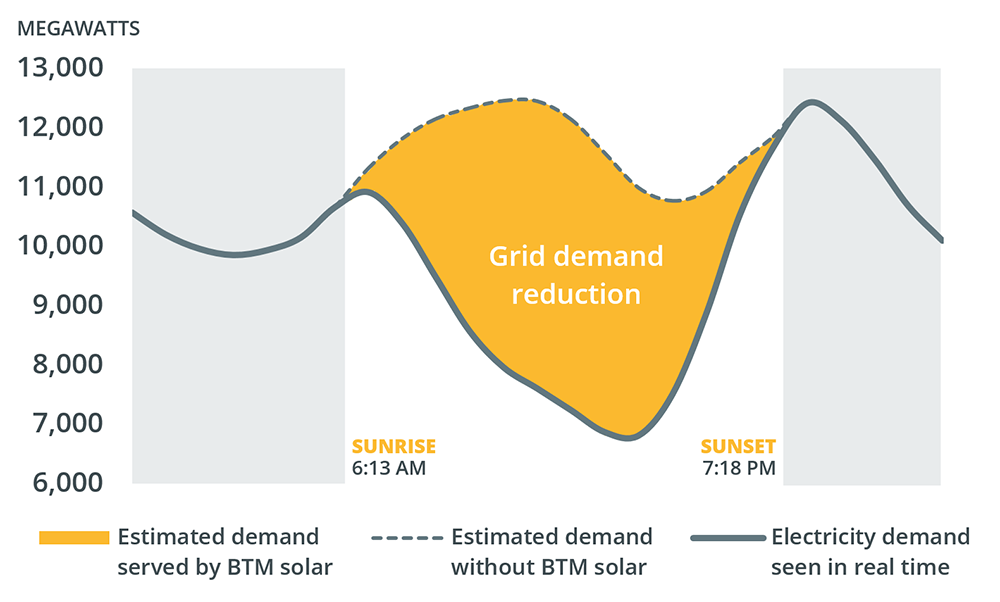
When conditions are right, the ISO sees a significant reduction in regional grid electricity demand from BTM PV.
For the first time since at least 2000, and possibly ever, grid electricity demand on Thanksgiving Day 2018 did not peak in the morning as New Englanders turned on their ovens; solar pushed the peak to after sunset.
A cool, sunny day in April 2018 marked the first time New Englanders used more grid electricity while they slept that night than during the middle of the day. The cause was BTM PV driving demand for grid electricity to a record low. Similar conditions have been observed many times since then, and are expected to become more common as more and more BTM PV is installed across the region.
This phenomenon is referred to as a “duck curve” because a line chart representing grid demand on such days resembles the silhouette of a duck. Duck curve days tend to occur during the spring. That’s typically when demand for electricity is lowest because temperatures are mild. Spring is also when solar panels perform their best. The sun’s position in the sky is optimal at this time of year, and trees haven’t yet sprouted leaves that will block some sunlight. Additionally, solar cells work best at cooler temperatures, losing efficiency in the heat and humidity of summer.
ISO system operators rely on accurate forecasts of grid demand because it’s critical to keep the power supply in near-perfect balance with demand at all times. But anticipating how much solar power there will be at any moment is a complex problem. With solar power meeting an increasing share of the region’s electricity consumption, operators need more sophisticated weather forecasts. The actual output from solar power installations can vary widely across the six New England states depending on the amount and location of cloud cover, haze, humidity, and rain, and snow, among other factors. New England has erratic weather conditions, and New Englanders know how hit or miss weather forecasts can be—even from town to town.
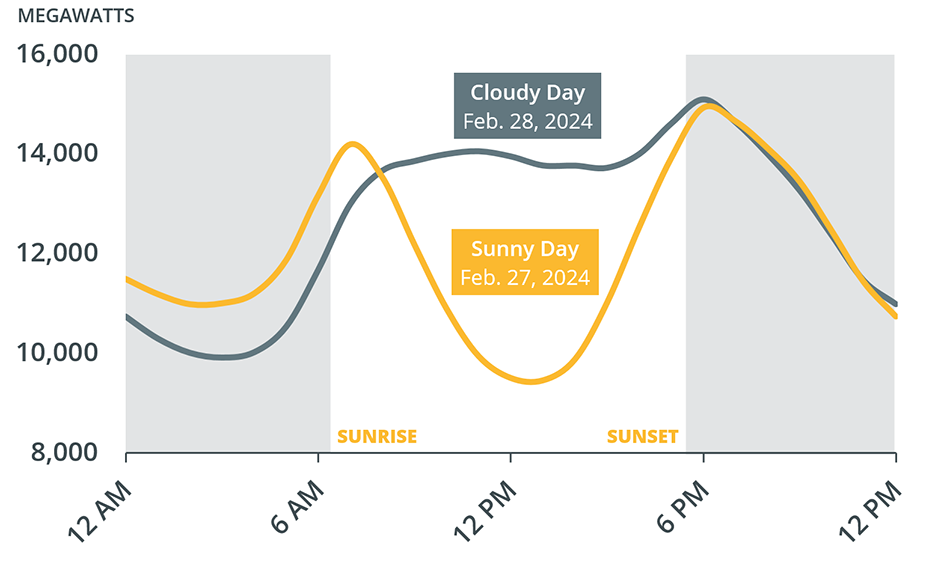
The effects of cloud cover can be seen in the graph below of grid demand on February 27, 2024, a sunny day, versus February 28, 2024, a rainy day.
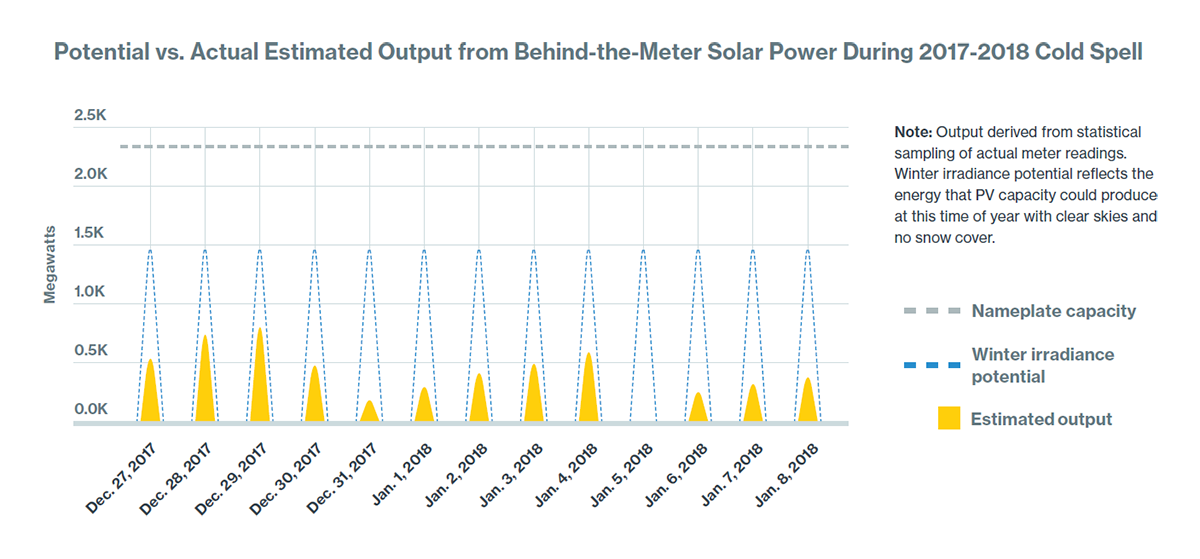
In New England, winter has the most variation in solar output because of snow, clouds, and fewer daylight hours. Cloud and snow cover prevented solar panels from reaching their seasonal potential during a historic 16-day cold spell from December 24, 2017, through January 8, 2018, and particularly during Winter Storm Grayson, which occurred during that period. In addition, consumers use the most electricity after sunset in winter, due to the shorter days. While solar helps reduce grid demand during sunny days without significant snow cover and can help conserve other fuels for use later in the day, it doesn’t reduce winter peak demand.
Changing weather conditions can lead to rapid and sizeable swings in electricity output from PV systems, which is why PV resources are called variable or intermittent. It’s also why the region will rely more heavily on other power resources that can help balance the fluctuations of the combined load and BTM PV, such as efficient, fast-start natural gas power plants, as more variable resources are installed in New England. In time, battery storage systems will be able to help manage through day-to-day variation, but may not help when unfavorable solar conditions last for multiple days.
The ISO is actively pursuing new and innovative ways to integrate large amounts of solar power. We developed the nation’s first long-term, multistate forecast of PV capacity, and launched a new system to forecast daily solar production in March 2019. The ISO has a full-time meteorologist on staff to help with more precise weather forecasting. The ISO has also incorporated improved modeling of BTM solar power in calculations that impact the wholesale markets.
We also continue to implement initiatives to help us operate the grid reliably despite volatile changes in electricity demand. Considerations include: