New England’s wholesale electricity markets work together to ensure the constant availability of competitively priced electricity for the region’s 15 million residents. The markets connect buyers and sellers of electricity, helping to balance supply and demand on the power system every second of every day. The markets also help spur innovation in new technologies and signal when investment is needed to maintain reliability and efficiency.
For decades before market restructuring, the region’s utilities operated as vertically integrated, rate-payer-funded, regulated monopolies that generated, transmitted, and distributed electricity. Dissatisfied with investments that increased consumer rates while limiting funds for needed infrastructure, the federal government and the New England states introduced a new industry framework in the late 1990s: competitive, technology-neutral wholesale markets where privately developed resources would compete with each other to supply least-cost, reliable wholesale electricity. The goals of competitive wholesale electricity markets were to lower costs, encourage innovation, and shield consumers from unwise investments. (Learn about ISO New England’s responsibility for administering the region’s wholesale electricity markets.)
During this time, the New England states also began introducing clean energy incentives and emission-reduction goals, focusing first on reducing greenhouse gas (GHG) emissions from the electric power industry. Emissions regulations work well with the wholesale markets by making higher-polluting power plants more expensive to operate and providing a reliable means for cleaner resources to replace them.
Over the past 25 years, the market and policy approach has driven change in the direction the states have been seeking, spurring private investment in some of the most efficient, lowest-emitting power resources in the country, shifting investment costs and risks away from consumers, lowering wholesale prices, reducing carbon emissions, and enabling the transition to a system that emits even less carbon.
 The ISO’s continuous study of the transmission system has helped guide cooperative regional investment that not only improves reliability but also enables the competitive markets to work as designed. Transmission system upgrades allow the ISO to dispatch the most economic resources throughout the region, allow less-efficient resources to retire, and enable the interconnection of power plants with lower emissions. Upgrades have nearly eliminated congestion costs in the New England energy market and, with the aid of low natural gas prices and other factors, have helped drive down and mitigate “uplift” payments to run specific generators to meet local reliability needs.
When the wholesale markets opened to competition more than two decades ago, private companies invested billions of dollars in the development of natural-gas-fired power plants because they used advanced technology that made them run efficiently; were relatively inexpensive to build, site, and interconnect; and their lower carbon emissions compared to coal and oil plants helped the region meet state environmental policies. As lower-cost, highly efficient natural gas plants displaced older oil and coal plants in New England, wholesale electricity prices declined.
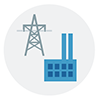
Natural gas is now the predominant fuel in New England, used to generate 55% of the electricity produced by the region’s power plants in 2024. As a result, the price of this single fuel sets the energy market price most of the time—so the prices of natural gas and wholesale electricity are closely linked. The high efficiency of natural-gas-fired generators and the generally low cost of nearby domestic shale gas (which emerged as a resource in 2008) are largely responsible for the decrease in the average annual price of New England’s wholesale electricity, after prices plummeted almost 50% following the shale gas boom. Lower wholesale prices translate into lower power-supply charges for consumers.
The COVID-19 pandemic and the continuation of regional industry trends led to historically low consumer demand for grid electricity in New England in 2020, setting the stage for the lowest average wholesale market prices since the inception of the region’s competitive markets in 2003.
Higher real-time power prices in 2013, 2014, 2018, and in recent years have largely been due to winter spikes in natural gas prices. When natural gas is constrained and at a premium—or when global market forces lead to high natural gas prices—oil generation may become more economic. High prices are an expected and efficient market outcome when system conditions are tight—signaling a system need. Winter prices will continue to exhibit volatility reflective of the fuel and weather constraints that limit the ability of power resources to produce electricity during extended cold conditions.
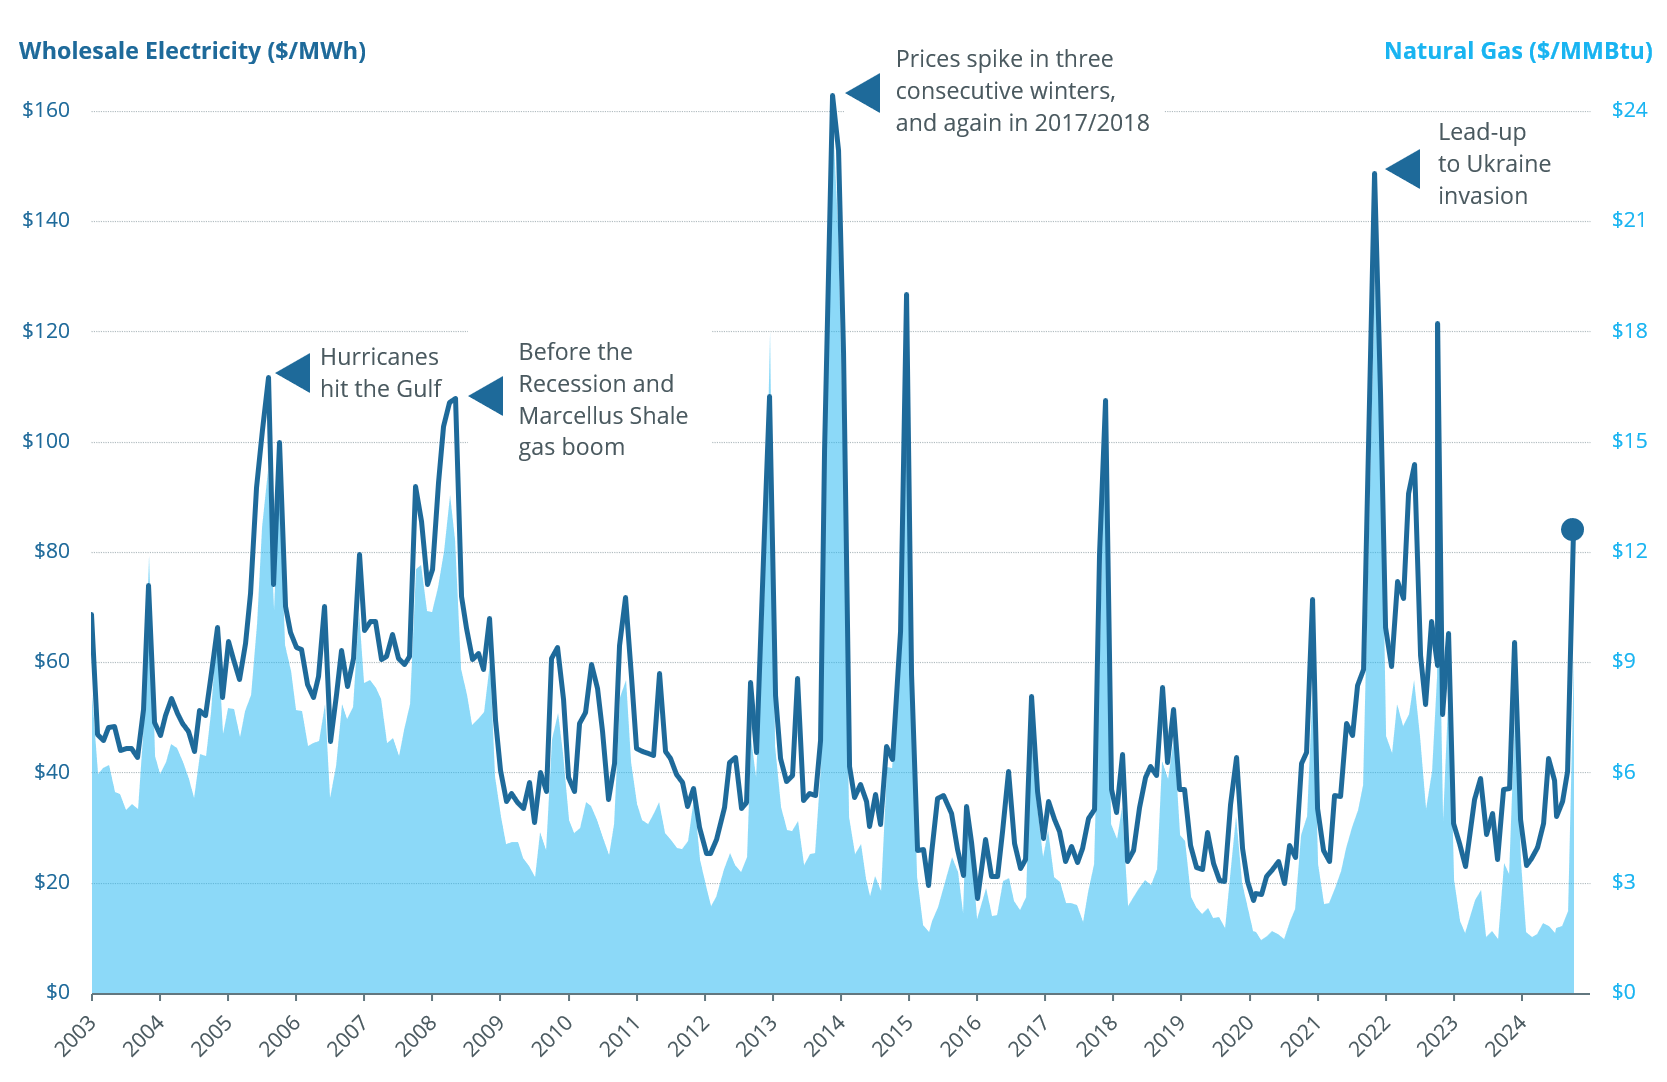
Power resources compete in the capacity market to take on a commitment to be available to meet projected future demand for electricity. Whereas the energy market value varies with fuel prices, the capacity market value varies with changes in amounts of electricity-producing and demand-reducing resources.
The Forward Capacity Market (FCM) procured resources through an annual auction held three years in advance of each commitment period. Strong competition generally kept capacity market auction prices low for most years. To better ensure power system reliability and cost-efficiency as the region’s resource mix evolves, the ISO is proposing reforms that will transition the capacity market to a prompt/seasonal schedule, with auctions held closer to commitment periods.
The capacity market works in tandem with the energy and ancillary service markets to provide revenue that attracts and sustains power resources needed today and into the future. Over the years, the FCM enabled participation of energy efficiency and demand response programs, as well as new resources including renewable energy facilities and energy storage technologies. And it has provided an orderly process for the retirement of nearly 8,000 MW of older fossil fuel units and nuclear plants.
Note: Forward Capacity Market values shown are based on auctions held roughly three years before each calendar year.
 Wholesale costs and retail rates can vary dramatically among the New England states and from year to year, mainly because wholesale and retail electricity markets are used to obtain different products. Wholesale market costs reflect the short-term market for electric energy and wholesale production capacity, whereas retail prices reflect a state’s longer-term, fixed-price contracts for energy; the recovery of the costs to pay for the transmission and distribution systems; stranded costs from legacy, vertically integrated utility investments; and various policy-driven adders, such as funding energy efficiency and solar photovoltaic incentive programs.
So while wholesale market costs have been consistent over time and across the New England states in recent years (ranging from 5.12 cents per kilowatt-hour (kWh) to 5.84 cents/kWh in 2024), the annual average price of electricity for residential customers can vary significantly across the New England states (ranging from 22.14 cents/kWh to 29.35 cents/kWh in 2024), due in large part to the different laws and power procurement practices of each state and the utilities within each state. (Source: 2024 Report of the Consumer Liaison Group).
Power system emissions have fallen dramatically since the early 2000s, and state laws in New England target even deeper reductions in carbon emissions through the middle of the century.
State policies are driving the pace of the clean energy transition—particularly those that promote the development of specific clean-energy resources to meet their public policy goals.
Several states have established public policies that direct electric power companies to enter into rate-payer-funded, long-term contracts for large-scale carbon-free energy that would cover most, if not all, of the resource’s costs. Long-term contracts carry risk given the rapid development and falling costs of new technologies—and this risk of stranded costs is placed back on consumers. As policymakers seek to convert the transportation and heating sectors to carbon-free electricity to fully meet climate goals, this public policy trend is expected to continue.
The region’s wholesale electricity markets complement state policy efforts by bolstering reliability and cost-efficiency as the region’s resource mix evolves. For example, the markets provide revenue for dispatchable balancing resources, which can include generation, storage, and demand response, as well as reliability services. These resources and services will play a vital role throughout the clean energy transition by filling gaps between supply and demand due to the intermittent nature of weather-dependent resources.
Meanwhile, the ISO believes pricing carbon within the competitive market structure is the simplest, easiest, and most efficient way to rapidly reduce electricity sector emissions. Carbon pricing would drive innovation in the market by compensating new and existing clean energy resources for carbon-free energy, while also providing powerful incentives to existing carbon emitting resources to reduce their emissions. Moreover, placing a realistic price on carbon would enable consumers to pay accurate, competitive prices without the risk of paying for stranded costs. This concept, which would require support and action from both the state and federal regulatory community, would be an efficient mechanism to drive the clean energy transition.
Annual auctions in the Forward Capacity Market (FCM) ensure the system has sufficient resources to meet future electricity demand. Obligations to provide capacity are determined through these auctions three years before the commitment period. Resources that clear receive monthly payments during the capacity year in exchange for their commitment to be available to meet the projected demand for electricity. That delivery period is called the capacity commitment period (CCP)—a one-year timeframe from June 1 through May 31 of the following year. As the year of need gets closer, monthly capacity auctions also take place.
| Auction Commitment Period |
Total Capacity Acquired (MW) | New Demand Resources (MW)1 |
New Generation (MW)2 |
Clearing Price ($/kW-month)3 |
|---|---|---|---|---|
| FCA 18 in 2024 for CCP 2027/2028 | 31,556 | 105 | 998 | $3.580 |
| FCA 17 in 2023 for CCP 2026/2027 | 31,370 | 130 | 619 | $2.590 |
| FCA 16 in 2022 for CCP 2025/2026 | 32,810 | 230 | 311 | ROP: $2.591 NNE: $2.531 & SENE: $2.639 |
| FCA 15 in 2021 for CCP 2024/2025 | 34,621 | 170 | 950 | ROP: $2.611 NNE: $2.477 & SENE: $3.980 |
| FCA 14 in 2020 for CCP 2023/2024 | 33,956 | 323 | 335 | $2.001 |
| FCA 13 in 2019 for CCP 2022/2023 | 34,839 | 654 | 8374 | $3.800 |
| FCA 12 in 2018 for CCP 2021/2022 | 34,828 | 514 | 174 | $4.631 |
| FCA 11 in 2017 for CCP 2020/2021 | 35,835 | 640 | 264 | $5.297 |
| FCA 10 in 2016 for CCP 2019/2020 | 35,567 | 371 | 1,459 | $7.030 |
| FCA 9 in 2015 for CCP 2018/2019 | 34,695 | 367 | 1,060 | System-wide: $9.551 SEMA/RI: $17.728/new & $11.080/existing |
| FCA 8 in 2014 for CCP 2017/2018 | 33,712 | 394 | 30 | $15.000/new & $7.025/existing |
| FCA 7 in 2013 for CCP 2016/2017 | 36,220 | 245 | 800 | $3.150 (floor price) NEMA/Boston: $14.999 |
| FCA 6 in 2012 for CCP 2015/2016 | 36,309 | 313 | 79 | $3.434 (floor price) |
| FCA 5 in 2011 for CCP 2014/2015 | 36,918 | 263 | 42 | $3.209 (floor price) |
| FCA 4 in 2010 for CCP 2013/2014 | 37,501 | 515 | 144 | $2.951 (floor price) |
| FCA 3 in 2009 for CCP 2012/2013 | 36,996 | 309 | 1,670 | $2.951 (floor price) |
| FCA 2 in 2008 for CCP 2011/2012 | 37,283 | 448 | 1,157 | $3.600 (floor price) |
| FCA 1 in 2008 for CCP 2010/2011 | 34,077 | 1,188 | 626 | $4.500 (floor price) |
1 Not counted as new is the demand-resource type once known as real-time emergency generation (RTEG). RTEG resources, which participated in FCAs 1 through 7, were treated as existing capacity and capped at 600 MW.
2 Some new capacity reflects increased capacity at existing resources.
3 Additional auction information, including pricing for import interfaces, is included in the Forward Capacity Auction Results file.
4 This total includes new generation acquired in both the primary auction (783 MW) and substitution auction (54 MW).
Zones
Capacity Procurement
More information can be found on these pages of the FCM Participation Guide: About the FCM and Its Auctions and Installed Capacity Requirement.